Q225 | Industrial Market Report | Jacksonville, FL
Q2 2025 Jacksonville Industrial Market Report
Market Overview
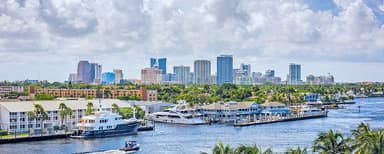
Jacksonville’s industrial market benefits from heightened port traffic and rapid population growth. Jacksonville’s industrial and logistics sectors are in a robust growth phase, propelled by major investment from national and international firms. These projects not only add high-value jobs, but also diversify the region’s economic base, from advanced manufacturing to green logistics and port modernization. Jacksonville’s Cecil Field is seeing tremendous growth with manufacturing HOLON EV vehicles and Otto Aviation planned 850K SF to manufacture jets. JAXPORT completed its $419M harbor deepening project, allowing access for lager ships and positions Jacksonville as the first East Coast top for Panamax vessels.
Highlights
- Vacancy rose over 200 bps in the past year but remains below the 7.4% national average despite a surge in new supply.
- Rents grew 5.9% year-over-year, outpacing the national average and ranking Jacksonville among the top U.S. markets for rent growth.
- Nearly 10M SF of industrial space is under construction, with over 20 million SF delivered since 2020.
- Industrial sales volume hit $1.2B over the past 12 months, up 30% YOY, with pricing at a record high of $102/SF.
By the Numbers
- Vacancy Rate: 6.3%
- Net Absorption SF: (6,209)
- Rent Growth: 5.9% | Q2 2025 | Source: CoStar Group, Inc.
Rent | Vacancy | Absorption
Rents have remained resilient in the face of softening demand. Jacksonville’s average lease rate is $10.90 SF NNN.
Jacksonville’s industrial market is navigating a shifting landscape marked by rising vacancy and a cooling pace of leasing. Vacancy has increased largely due to delivery of 5.3M SF of new space outpacing absorption, which totaled just 1.2M SF. Conditions remain righter in smaller-footprint product, with vacancy near 3% in buildings under 25,000 SF. Nearly 10M SF of vacancy industrial space is currently on the market (up 65% YOY). Despite the demand slowdown, leasing remains active among larger tenants, with close to 20 deals signed in the past year over 100,000 SF.
Construction
On the construction front, development activity remains elevated, with 9.6M SF underway following f ive years of aggressive growth that added over 20M SF to the market. The Ocean Way, West Side, and St Johns submarkets account for the majority of current projects, and while a handful of large buildings have already been preleased, many full-building opportunities remain available. With strong population in-migration and increased port traffic driving long-term fundamentals, Jacksonville continues to attract development capital and tenant interest alike.
By the Numbers
- Under Construction: 9.5M SF
- Construction Starts: 4.1M SF
- Net Deliveries: 1.1M SF | Q2 2025 | Source: CoStar Group, Inc.
% Rent Growth (YOY)
Source: CoStar Group, Inc.

SF in the Development Pipeline
Source: CoStar Group, Inc.

Sales
Sales activity has remained robust, with notable transactions recorded in each of the city’s core submarkets. Transactions averaged from $112 to $230 per SF, reflecting solid investor appetite for high-quality small-to-midsized assets. The West Side market stood out with some of the highest per-SF pricing in the market, highlighted by at $8.5M trade for $1,049/SF at 4371 Sportman Club Rd, indicative of premium IOS assets with strong locational advantages and specialized build-outs.
Meanwhile, Riverside saw a concentration of institutional-caliber activity, including the $15M acquisition of a 182,724-SF facility at 109 Stevens St ($82.09/SF), one of the largest transactions in terms of SF this year and 540 Beautyrest Ave at 221,000 SF. The area’s range of trades demonstrates diverse investor strategies tailored to infill users, value-add repositioning, and long-term holds.
By the Numbers
- Number of Transactions: 56
- Average Sale Price: $4.3M
- Average Price Per SF: $85.00
- Total SF Traded: 2.4M
- Sales Volume: $155M | Q2 2025 | Source: CoStar Group, Inc.
2025 Industrial Closings